Order Book Panel
The Order Book panel reveals the hidden structure of a market by showing you all the pending buy and sell orders waiting to be filled. While a chart shows you where prices have been, the order book shows you where traders are positioned right now—giving you insight into potential support, resistance, and liquidity before you trade.
Opening the Panel
Press / to open the Command Palette, type OB, and press Enter. The Order Book panel will appear, ready for you to select a market.
How Order Books Work
Every prediction market operates on a simple principle: buyers and sellers place orders at prices they're willing to transact. When a buyer's price meets a seller's price, a trade occurs. But not all orders execute immediately—many sit and wait for someone to meet their price. The order book shows you all these waiting orders.
Think of it like an auction house where both buyers and sellers publicly post their offers. Buyers say "I'll pay X for this contract" and sellers say "I'll sell my contract for Y." The order book displays all these standing offers, organized by price.
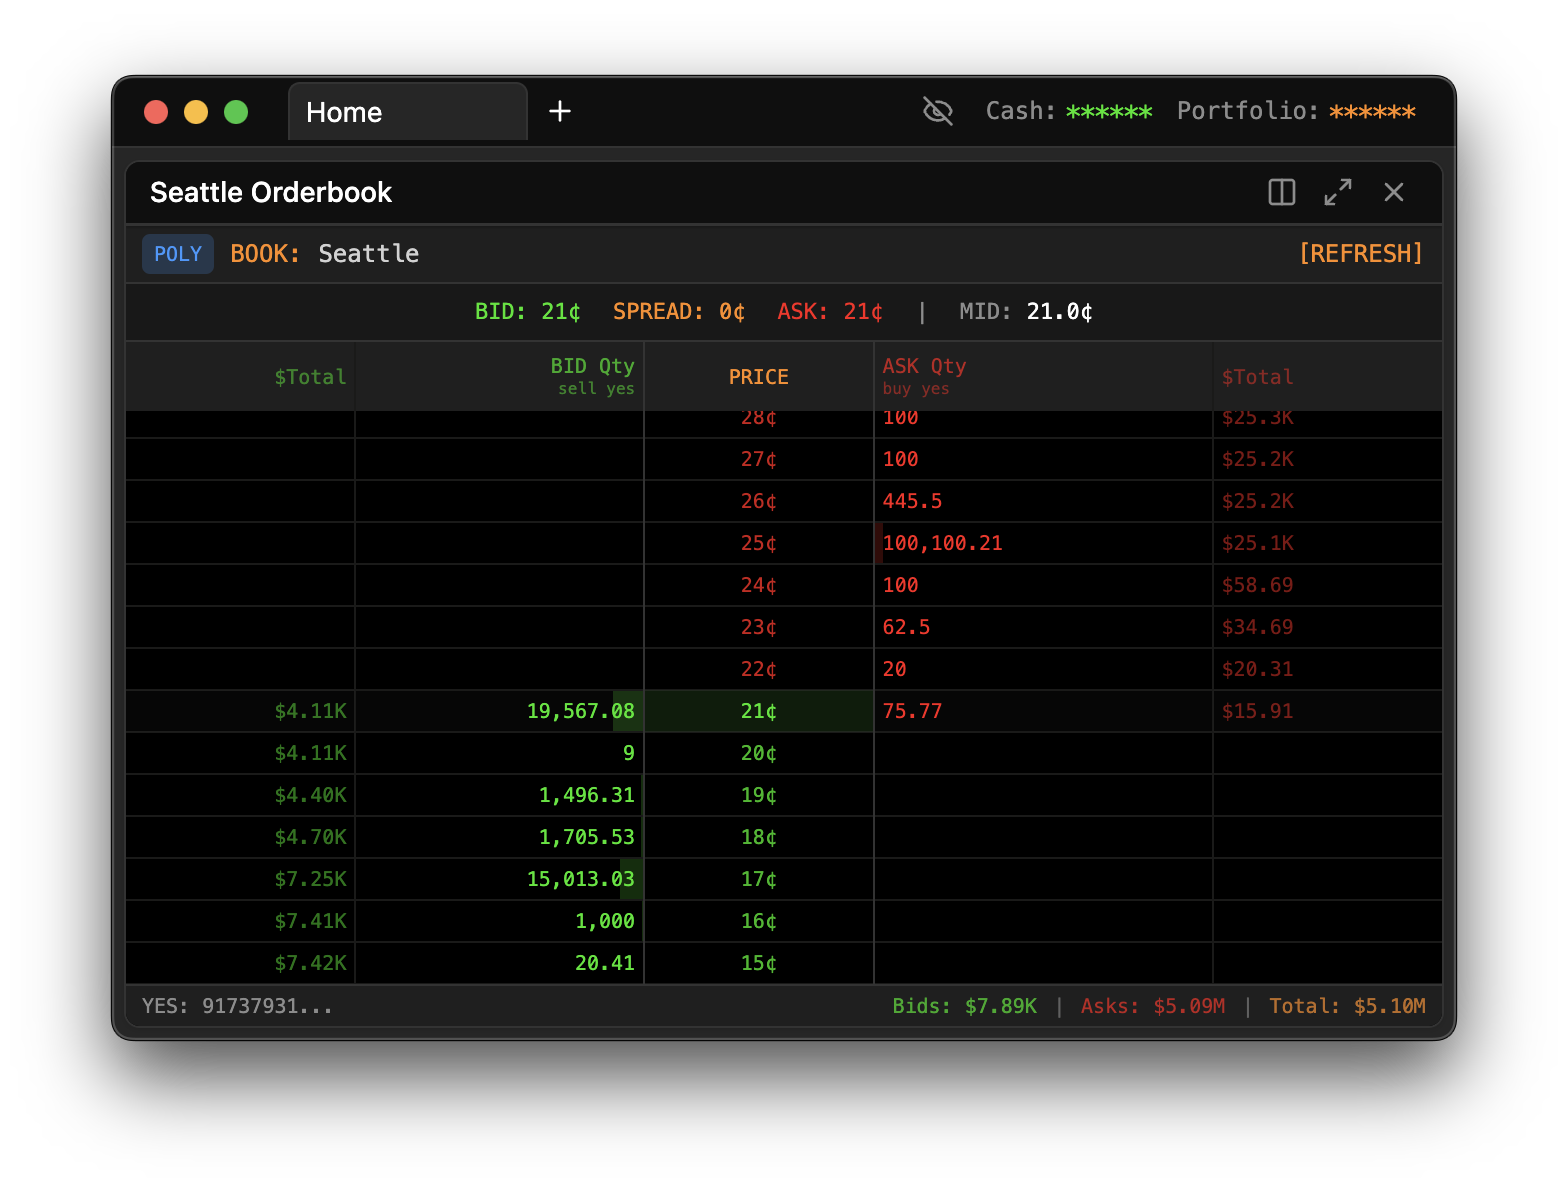
Anatomy of the Order Book
The order book is split into two sides, typically displayed vertically with one above the other, or side by side.
The Bid Side (Buyers)
The bid side shows all the pending buy orders. These are traders who want to purchase contracts but are only willing to pay up to a certain price. The bids are sorted with the highest price at the top, because the highest bid is closest to executing.
When you look at the bid side, you're seeing the collective demand for the contract. The quantities tell you how much buying interest exists at each price level.
The Ask Side (Sellers)
The ask side shows all the pending sell orders. These are traders who own contracts and are willing to sell them, but only at or above a certain price. The asks are sorted with the lowest price at the top, because the lowest ask is the best deal currently available for buyers.
The ask side represents the available supply. If you wanted to buy right now, you'd be taking from the ask side.
The Spread
The gap between the highest bid and the lowest ask is called the spread. This gap exists because there's currently no price where buyers and sellers agree.
A tight spread (small gap) indicates a liquid market. Many traders are competing to buy and sell, pushing their prices close together. In a market with a 1-cent spread, you can get in and out without losing much to the spread.
A wide spread (large gap) indicates less liquidity. Fewer traders are actively quoting, so there's more distance between what buyers want to pay and what sellers want to receive. Wide spreads are common in obscure markets or during off-hours.
Reading Quantity and Depth
Each price level shows a quantity—the total number of contracts available at that price. But what do these numbers really tell you?
Large quantities at a price level suggest that price is significant to traders. A big bid sitting at 45 cents might act as support—if the price drops to that level, that large buyer is waiting to absorb selling pressure. Similarly, a large ask at 55 cents might act as resistance—a seller with a lot of inventory waiting at that price.
Depth bars provide a visual representation of quantity. Longer bars mean more contracts at that level. By scanning the depth bars, you can quickly see where the liquidity is concentrated without reading every number.
Thin order books with small quantities at each level mean the market can move quickly. A single large order might sweep through multiple price levels. Thin books are more volatile but can also present opportunities if you're patient and use limit orders.
Real-Time Updates
The order book is a living thing. New orders arrive, existing orders get filled or cancelled, and prices shift constantly. The Order Book panel streams these updates in real-time, so you're always seeing the current state of the market.
When an order changes, you may notice a brief flash highlighting the affected row. This visual cue helps you spot activity without constantly watching every number.
For Kalshi markets, the panel connects to Kalshi's real-time ticker feed. For Polymarket, it uses snapshot data that refreshes frequently. Either way, you're seeing a near-instantaneous view of order flow.
Using the Order Book for Trading Decisions
Assessing Liquidity Before Trading
Before placing a trade, check the order book to understand what you're getting into. If you want to buy 100 contracts, look at the ask side—is there enough quantity at reasonable prices? If the asks only have 20 contracts at each level, your order will sweep through multiple price levels, and you'll pay more than the quoted price for the full size.
Spotting Large Orders
Big orders stand out in the book. A single level with vastly more quantity than surrounding levels indicates a significant trader has planted a flag at that price. These levels often act as magnets—price tends to gravitate toward large orders because traders know liquidity is available there.
But be aware that large orders aren't always what they seem. Some traders place large orders to intimidate others or to give a false impression of demand or supply, then cancel before they get filled. This is called "spoofing" and while it's against rules on many exchanges, it still happens.
Watching Order Flow
Pay attention not just to the static picture, but to how the book changes over time. If you notice bids consistently appearing and growing while asks thin out, that's bullish pressure building. The opposite—asks growing while bids shrink—suggests bearish pressure.
When a price level suddenly disappears, it means either the orders were cancelled or they were filled. If they were filled, you'll often see the price move through that level. Understanding this flow helps you anticipate short-term moves.
Combining with Chart
The Order Book and Chart panels complement each other perfectly. The Chart shows you the historical path and current trend; the Order Book shows you the current battlefield of supply and demand.
A common pattern: the chart shows price approaching a round number or previous support level. You check the order book and see a large bid sitting at that level. This combination of technical chart level and visible order book support increases your confidence that the level might hold.
Troubleshooting
If the order book appears empty, the market may have no standing orders—this is rare for active markets but common for illiquid ones. Verify you've selected an active, open market. If the market is closed or settled, there won't be any orders.
If updates seem to have stopped, check your internet connection. The panel requires an active connection to receive real-time data. Try selecting a different market and then switching back to force a reconnection.