Event Viewer Panel
The Event Viewer is your comprehensive dashboard for exploring prediction market events. It combines market browsing, price tracking, and charting into a single powerful panel, letting you quickly research any event by simply pasting its URL.
Opening the Panel
Press / to open the Command Palette, type EV, and press Enter. The Event Viewer will open, ready to accept an event URL.
Jumping Directly to an Event
One of the Event Viewer's most powerful features is its ability to open directly to any event. When typing EV in the Command Palette, press Space or Tab before hitting Enter. This "locks" the command and lets you paste a URL.
Copy any Kalshi or Polymarket event URL from your browser and paste it in. The Event Viewer will immediately load that event with all its markets, prices, and chart data. This workflow makes it incredibly fast to research any event you come across—just copy the URL and paste it into Panther.
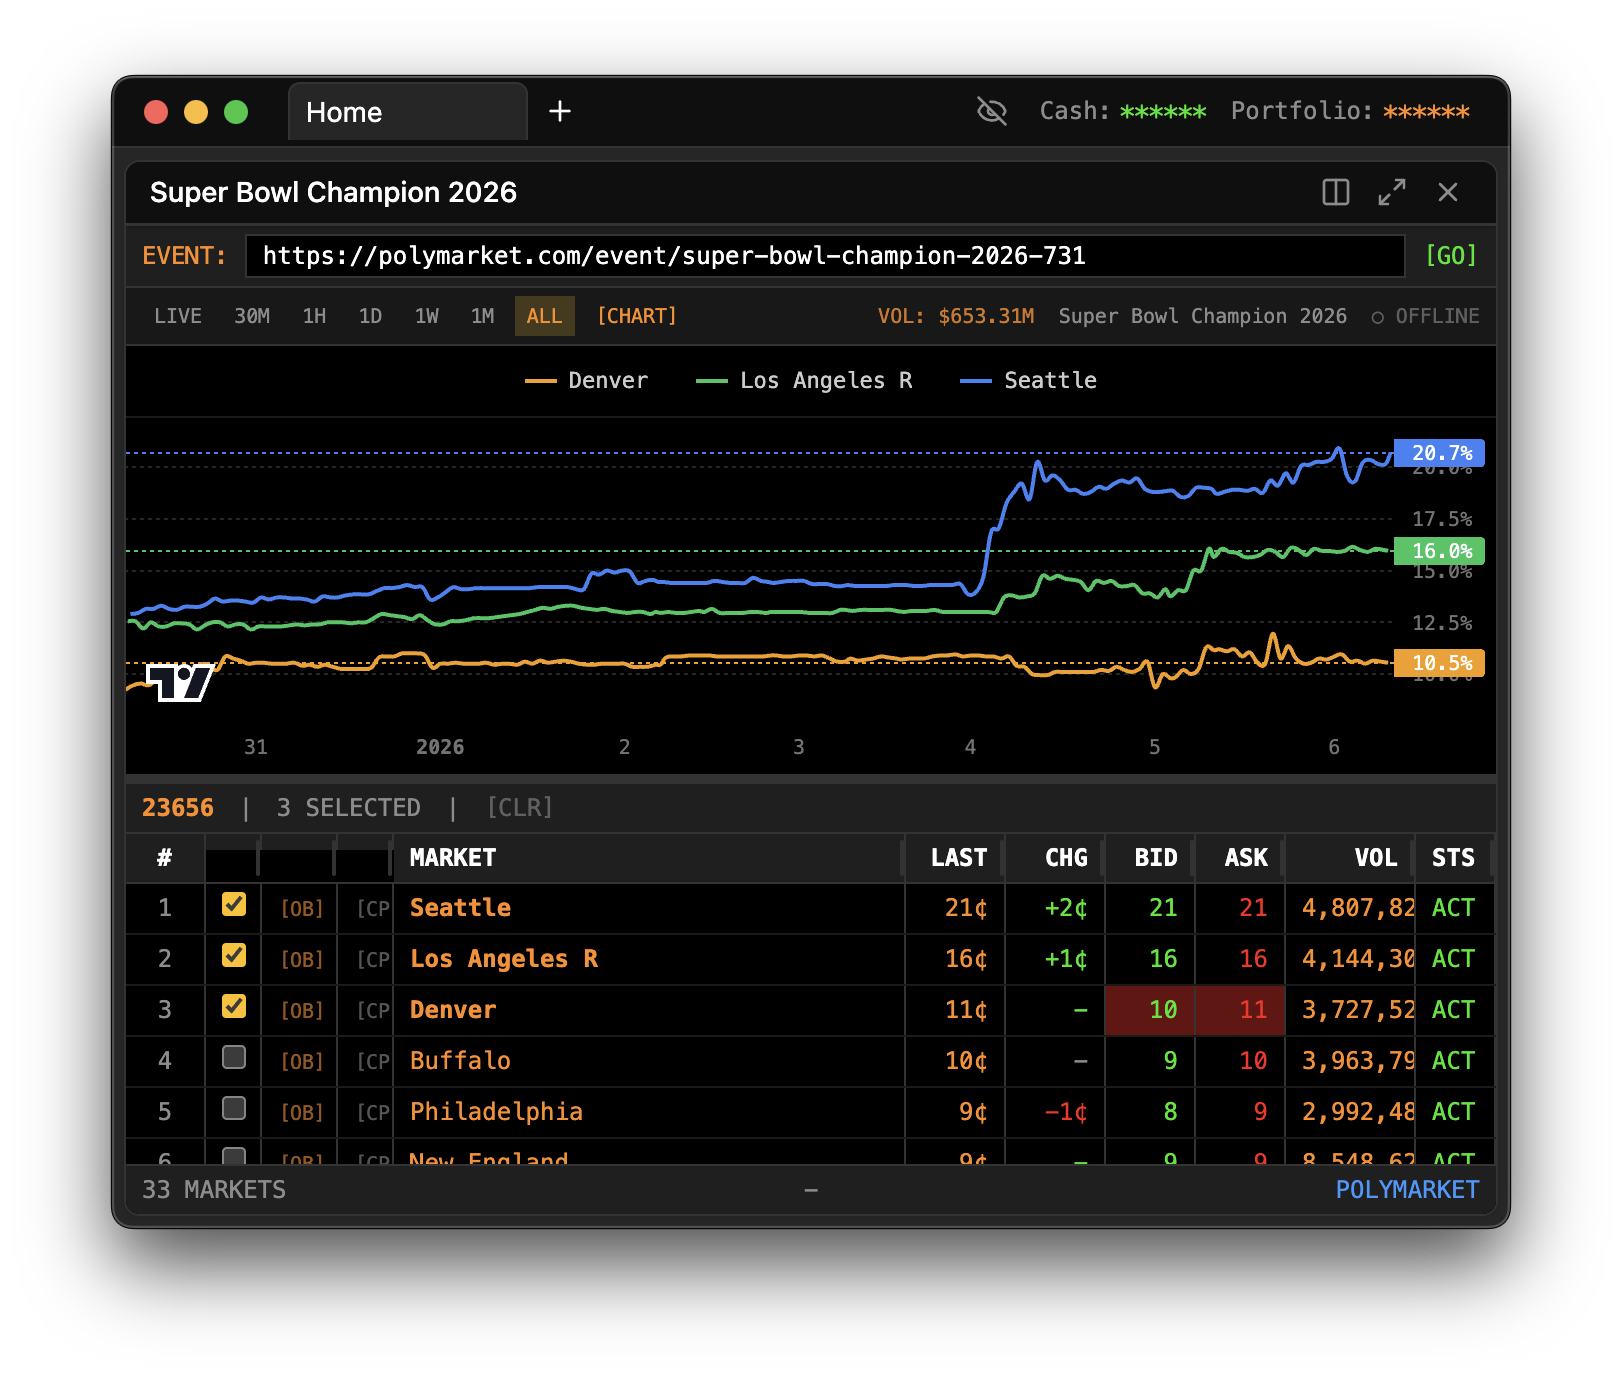
The Three-Section Layout
The Event Viewer is organized into three main sections that work together to give you a complete picture of any event.
The URL Input Bar
At the top of the panel, you'll find a text input where you can paste event URLs at any time. This isn't just for initial loading—you can paste a new URL whenever you want to switch to a different event. The panel immediately fetches the new event's data and updates all sections.
Supported URL formats include:
- Kalshi event URLs (e.g.,
https://kalshi.com/markets/kxbtc/...) - Polymarket event URLs (e.g.,
https://polymarket.com/event/...)
The Integrated Chart
The middle section displays an interactive chart for the currently selected market. This isn't a separate Chart panel—it's built right in, so you don't need to open multiple windows to see price history.
The chart section is resizable. Drag the border between the chart and the market table to give more or less space to either section. If you're focused on price action, expand the chart. If you're comparing multiple markets, shrink the chart and give more room to the table.
The Market Table
The bottom section shows a table of all individual markets within the event. Prediction market events often contain multiple related markets—for example, an election event might have markets for each candidate, or a crypto event might have markets for different price thresholds.
Each row in the table represents one market and shows:
- The market title or description
- Current Yes price
- Current No price
- Trading volume
Click any row to select that market, which updates the chart above to show that specific market's price history.
Real-Time Price Updates
The Event Viewer maintains live WebSocket connections to stream real-time price updates. You don't need to refresh or reload—prices update automatically as trades occur.
When a price changes, the affected cell briefly flashes to draw your attention. This visual feedback helps you spot activity across multiple markets without staring at every number. In a fast-moving event, you'll see flashes rippling across the table as traders react to news.
This real-time capability is especially valuable around event deadlines or news announcements, when prices can move rapidly across multiple markets simultaneously.
Navigating Markets Within an Event
Large events can have dozens of individual markets. The market table helps you navigate this complexity.
Click column headers to sort the table. You might sort by volume to see which markets are most actively traded, or by Yes price to find the favorites versus longshots. Sorting helps you quickly identify the markets worth focusing on.
Use any filtering options to narrow down what you see. Some events have markets of different types—binary yes/no markets, multi-outcome markets, or different expiration dates. Filters help you focus on the subset you care about.
From Event Viewer to Deeper Analysis
The Event Viewer is designed as your starting point for research. Once you've identified interesting markets, you can open dedicated panels for deeper analysis.
For example, after browsing an event and finding a specific market that interests you, you might open a dedicated Chart panel for that market to see more detailed price history, and an Order Book panel to see the current liquidity. The Event Viewer gave you the overview; the specialized panels let you drill down.
Common Workflows
News-driven research: You see a news headline and wonder how prediction markets are pricing the outcome. Find the relevant market on Kalshi or Polymarket, copy the URL, and paste it into the Event Viewer. Within seconds, you can see current prices, how they've moved recently, and how different related markets compare.
Comparison shopping: Some questions have multiple related markets. The Event Viewer's table layout lets you compare prices across these markets side by side. For instance, if you're interested in a range of outcomes, you can quickly scan the Yes prices across all the threshold markets.
Monitoring during live events: Keep the Event Viewer open during a live event (a debate, a sports game, an earnings announcement). Watch the flashing prices as the market reacts to developments in real time. The integrated chart shows you the price movement as it happens.
Troubleshooting
Event not loading after pasting URL: Make sure you've pasted a complete, valid URL. Partial URLs or URLs from unsupported exchanges won't work. Also verify the event still exists—some markets get delisted or merged.
Prices not updating: Check your internet connection. The panel needs an active connection to receive real-time data. If you've been idle for a while, the WebSocket connection may have dropped—try pasting the URL again to force a reconnection.
Chart area is blank: After loading an event, you need to click on a specific market in the table to load its chart. The chart doesn't know which market to display until you select one.