Kalshi Markets Panel
The Kalshi Markets panel is your gateway to exploring the entire universe of Kalshi prediction markets. With hundreds of events spanning politics, economics, weather, and more, this panel helps you discover opportunities, filter by your interests, and quickly identify the most active and liquid markets.
Opening the Panel
Press / to open the Command Palette, type KM, and press Enter. The panel will load and begin fetching the current list of Kalshi events.
The Market Table
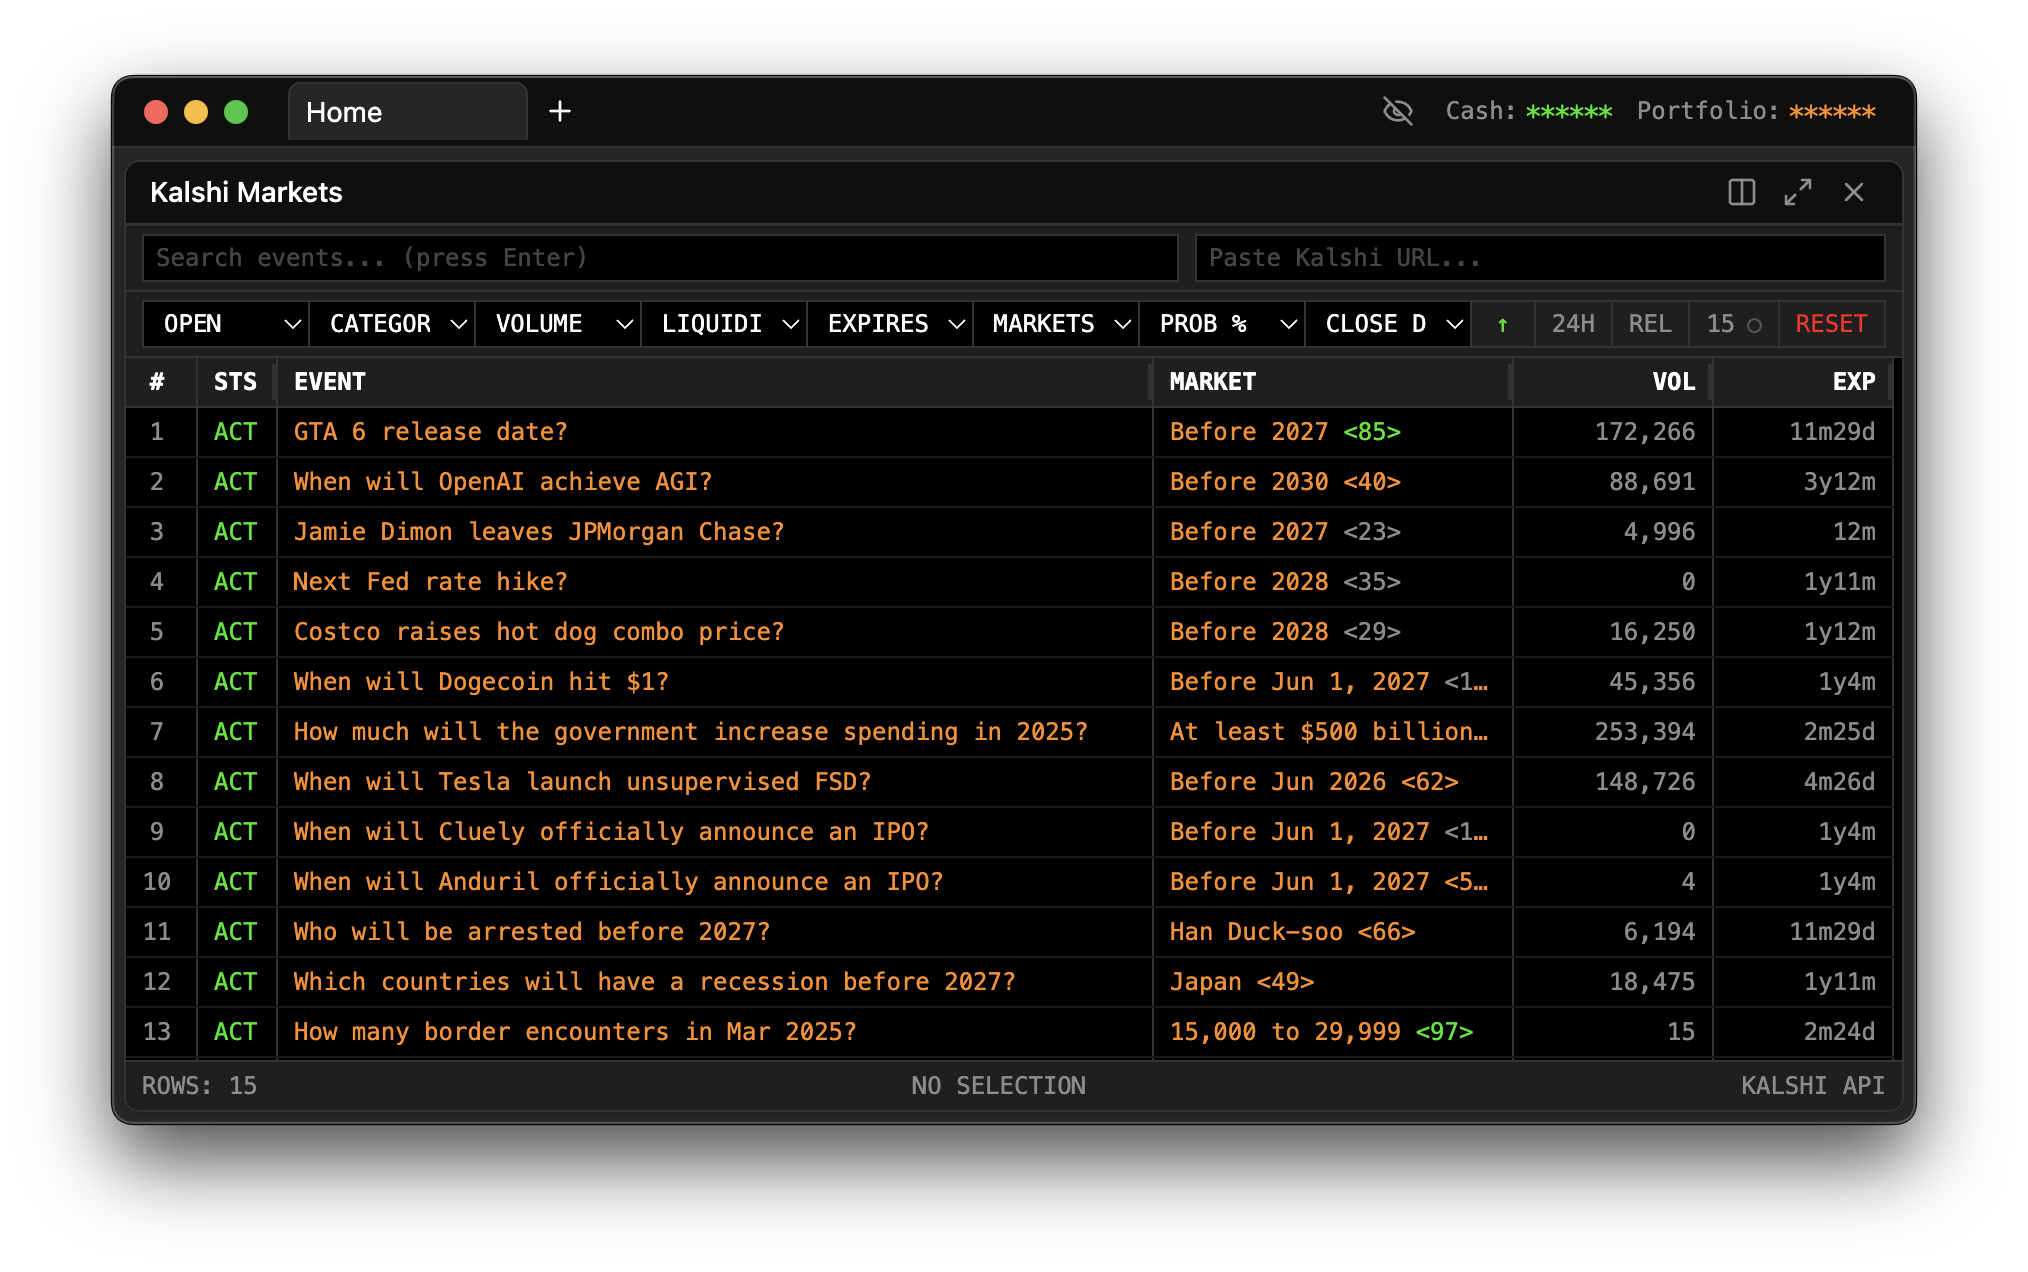
The heart of the Kalshi Markets panel is its data table, which lists every available event on the exchange. Each row represents a single event, which may contain one or many individual markets.
Here's what each column tells you:
Event shows the event name and category. Kalshi organizes markets into categories like Politics, Economics, Climate, and more. The event name describes what question is being asked—for example, "Fed Interest Rate Decision" or "Daily Weather in New York."
Markets indicates how many individual markets exist within this event. Some events are simple yes/no questions with a single market. Others, like "Which party wins the presidency," might have multiple markets for different candidates or outcomes.
Volume represents the total dollar value of contracts traded in this event across its lifetime. High volume indicates significant interest and generally means better liquidity. Events with thousands or millions in volume are heavily traded and typically have tight spreads.
24h Volume focuses on recent activity, showing the volume traded just in the past 24 hours. This column helps you identify what's hot right now. A surge in 24-hour volume often signals breaking news or approaching event deadlines.
Liquidity measures how much is currently available to trade at competitive prices. High liquidity means you can get in and out of positions easily without moving the market. Low liquidity markets might be interesting but can be harder to trade.
Closes shows how much time remains until the market closes for trading. Some markets close when an event begins (like a sports game), while others remain open until shortly before a decision is announced. The countdown helps you prioritize—markets closing soon need attention now.
Sorting Your View
Clicking any column header sorts the table by that column. Click again to reverse the sort order. Strategic sorting helps you find exactly what you're looking for.
Sort by Volume to see the most actively traded events. High-volume events typically have the best liquidity and the most competitive prices. If you're new to prediction markets, starting with high-volume events is a good way to learn without getting stuck in illiquid positions.
Sort by 24h Volume to find what's trending today. Spikes in daily volume often indicate developing stories or imminent event resolutions. These markets might offer more volatility and opportunity—or more risk.
Sort by Liquidity to focus on markets where you can trade meaningful size. If you're planning to deploy significant capital, you want markets where your orders won't move the price dramatically.
Sort by Closes to see what's expiring soon. Markets approaching their close date often see increased activity as traders finalize their positions. These can be opportunities if you have conviction about an imminent outcome.
Sort by Recently Added to discover new markets before they become crowded. Kalshi regularly launches new events, and being early to a market can sometimes offer edge—though new markets may initially be less liquid.
Filtering the List
With hundreds of events available, filters help you focus on what matters to you.
Status filters let you choose which markets to see. Open markets are currently tradeable—this is the default and usually what you want. Closed markets have stopped accepting new trades but haven't settled yet. Settled markets have resolved and paid out to winners. Most of the time, you'll focus on open markets, but checking closed or settled can be useful for research.
Volume filters hide low-activity events. If you only want to see markets with at least $10,000 in volume, set that threshold and the noise disappears. This is particularly useful if you find the long tail of obscure markets distracting.
Liquidity filters work similarly, hiding markets below a certain liquidity threshold. This ensures you only see markets where you can actually trade efficiently.
Expiration filters let you focus on time horizons that match your strategy. Maybe you only trade markets resolving this week, or you prefer longer-dated events with more time for your thesis to play out. These filters let you segment by timeline.
Two Ways to Browse
The panel offers two viewing modes to match different workflows.
Browse All mode is the default. You see the full table of events matching your current filters. This is great for discovering markets, scanning for opportunities, and getting an overview of what's available on the platform.
Single Event Focus mode activates when you click into a specific event. Instead of seeing all events, you now see only the markets within that particular event. This view shows you detailed pricing for each individual market, making it easy to compare different outcomes or time buckets within one event.
To return to Browse All mode, simply close the focus or navigate back. The ability to zoom in and out this way lets you fluidly move between macro-level scanning and micro-level analysis.
Real-Time Updates
The Kalshi Markets panel doesn't just load once and go stale. Prices and volumes update in real-time as trades occur across the exchange.
When a price changes, the affected cell briefly flashes to draw your attention. This is especially useful when you're watching multiple markets—you don't have to stare at numbers to notice movement. The flashes tell you where the action is.
The countdown timers for closing markets tick down continuously, so you always know exactly how much time remains.
From Browsing to Trading
The Kalshi Markets panel is designed for discovery. Once you've found interesting markets, you can open specialized panels for deeper analysis. Click through to an event and then open a Chart panel to see price history, or an Order Book panel to examine current liquidity in detail.
Many traders keep the Kalshi Markets panel open in one tab as their "home base," using it to monitor the overall landscape and spot opportunities. When something catches their eye, they open additional panels for that specific market.
Tips for Effective Market Scanning
Check 24h volume spikes. A market that suddenly has 10x its normal daily volume is telling you something. Maybe news broke, maybe a deadline is approaching, maybe a whale is entering or exiting. Investigate volume anomalies.
Watch for new high-profile events. When Kalshi launches a market on a hot topic, early activity can be a good time to establish positions before the crowd arrives and prices become more efficient.
Compare related events. Sometimes you'll see multiple events covering similar topics. Comparing their prices can reveal inconsistencies or arbitrage opportunities—or simply help you understand how the market views different scenarios.
Don't ignore low-volume gems. While liquidity is important, some smaller markets can offer compelling opportunities precisely because fewer people are watching them. Just be prepared for wider spreads and more difficulty exiting if you need to.
Troubleshooting
If the market list isn't loading, check your internet connection. The panel fetches data from Kalshi's API and needs connectivity. If loading seems slow, Kalshi's servers may be under heavy load—try again in a few moments.
If your filters return zero results, your criteria may be too restrictive. Try relaxing one filter at a time to see which one is excluding everything. Remember to check that you haven't accidentally filtered to only show closed or settled markets if you're looking for tradeable opportunities.